Using the Summary Display Mode
The Summary display mode provides an overview of your activities. It consists of a customizable table that displays detailed budget, performance, and other data for each activity. You can use the Summary display mode to compare activities against each other, evaluate activity performance, and compare cost and spend data at a glance.
Before you begin
To follow the instructions in this section:
-
You must have access to the Activities section in your Uptempo instance.
Access the Summary Display Mode
You can access the Summary Display Mode at any time while you're in the Activities section of Uptempo.
To access the Summary display mode:
-
In the Activities section, switch the
 Timeline /
  Summary toggle button in the toolbar to the Summary setting.
When you are using the Summary display mode, you can change your display settings (see Filtering and Grouping Activities), as well as create and apply views (see Save Activity Hierarchy Display Settings as Views) to save your display settings.
Because the table in the Summary display mode contains a large number of available data columns, you can configure these columns according to your needs and preferences. You can:
-
Select which of the available columns are displayed in the table
-
Change the order of the displayed columns
-
Pin columns that you want to keep visible as you scroll the table horizontally
Note
Uptempo automatically applies your last saved column configuration the next time you return to the Summary display mode, even if you logged out of Uptempo or closed your browser.
Because your column configuration is saved to your browser's local storage, it will not be applied if you log in to your account with a different browser, and will be reset if you clear your browser data (cache).
Customize the Summary table
By default, the table in Summary displays the following columns:
-
Activities
-
In-market Dates
-
Estimated Costs
-
Estimated Costs Roll-Up
-
Estimated Costs Left
There are many other columns available to display data about spend, impact, KPIs, etc. You can customize which columns are shown in the Summary table according to your needs. You can also configure the display order of the columns, and pin columns to keep them visible as you scroll the table side-to-side.
Select which columns are displayed
In the Summary table, only the Activities column is always displayed. For all other available columns, you can add or remove them from the table at any time to display or hide them.
To choose which columns are displayed, follow these steps:
-
In Uptempo, click Activities in the sidebar to view the activity hierarchy.
-
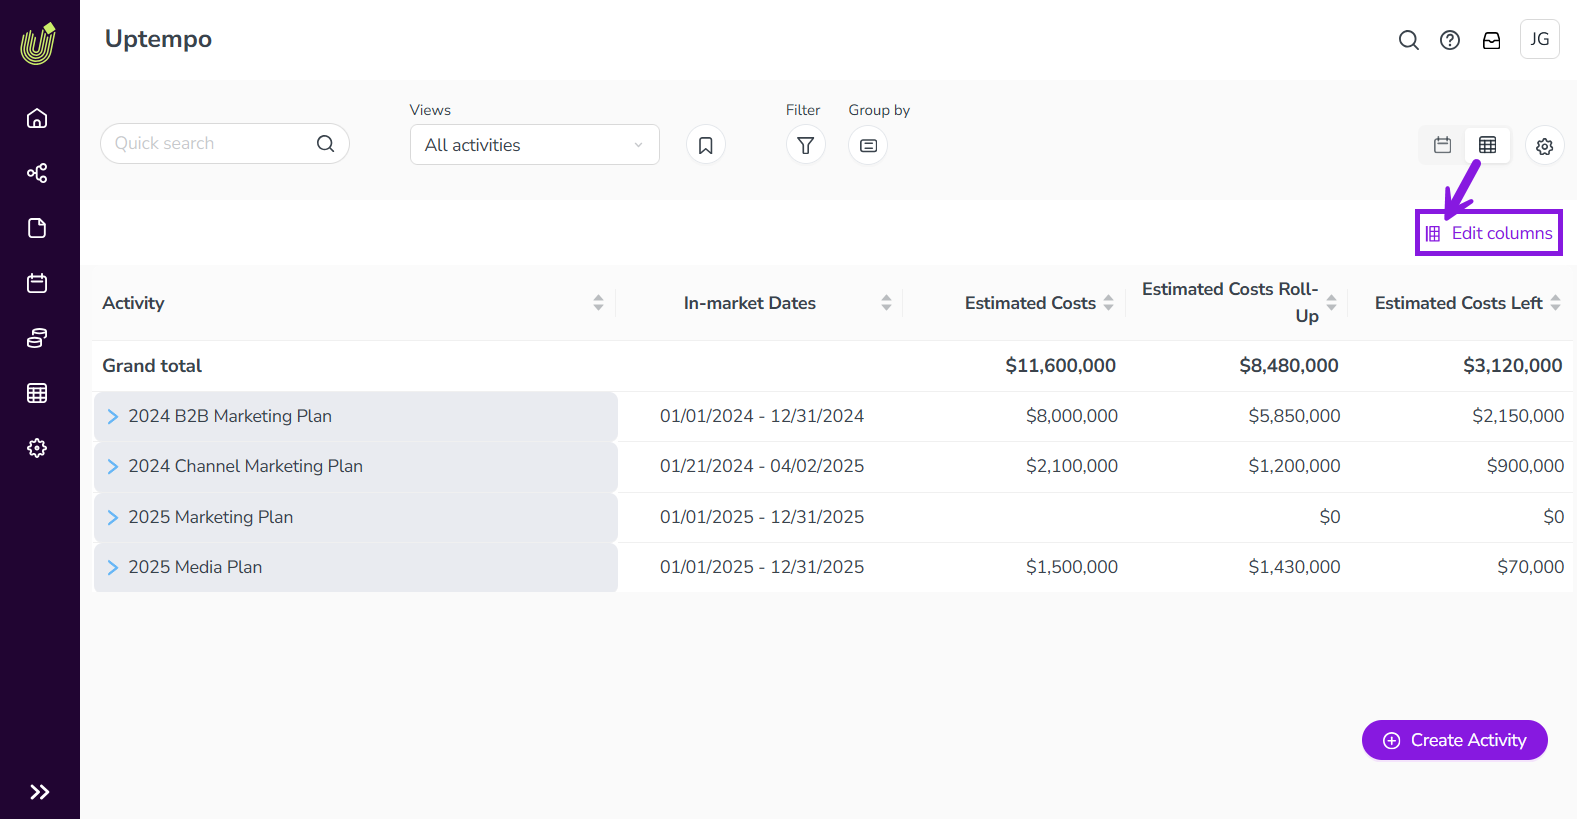
Click
Summary to switch to the Summary display mode. -
Click
 Edit columns:
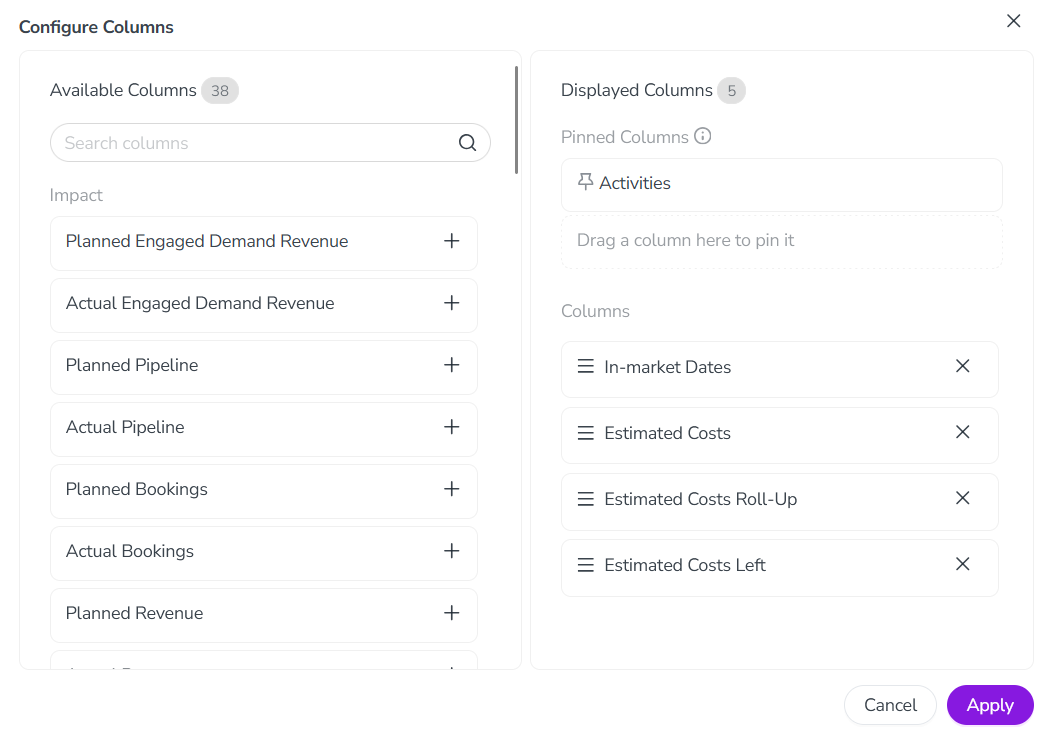
The Configure Columns menu opens.
-
To add a column to the table, find the column in the Available Columns list and click + on the column:
-
The Available Columns list is organized into sections based on type of data the column contains.
-
You can filter the Available Columns list by keyword using the Search columns field.

The column is added to the Columns section of the Displayed Columns list.
-
-
To remove a column from the table, find the column in the Displayed Columns list and click x on the column.
The column is removed from the Columns section of the Displayed Columns list.
-
To save your changes, click Apply.
The Configure Columns menu closes, and the Summary table updates to show the new column configuration.
Reorder and pin columns
You can change the order in which displayed columns are shown in the table, as well as pin columns so that they remain visible when you scroll the table horizontally.
To change the column display order and pin columns, follow these steps:
-
Open the Configure Columns menu in the Summary display mode.
-
For instructions, see the section Select which columns are displayed.
-
-
In the Displayed Columns list, find the column you want to reorder or pin under the Columns section:
-
To change a column's display position: Use the column's
 Order handle to drag it to the place in the list where you want it to be displayed.
-
The topmost column in the order is displayed in the leftmost position in the table (after the Activity column and any pinned columns), and so on.
-
-
To pin a column: Use the column's
Order handle to drag it to the Pinned Columns section.-
You can pin up to 3 columns (in addition to the Activity column, which is always pinned).
-
If you already have 3 columns pinned and drag another column to the Pinned Columns section, it will replace (unpin) the column you drop it on.
-
To unpin a column, drag it from the Pinned Columns section to the Columns section.
-
You can adjust the display order for pinned columns in the same way as for unpinned columns. Pinned columns are always displayed in the leftmost 3 positions in the table.
-
-
-
Optional: Repeat the last step for any other columns you want to reorder or pin.
-
To save your changes, click Apply.
The Configure Columns menu closes, and the Summary table updates to show the new column configuration.